I have worked on projects where we have implemented dual-write synchronously. Microsoft has released dual-write async and having gone through the articles from Microsoft, I believe there are important design considerations to make before you use one-way or another.
Here I document:
- What these models are.
- When to consider one over the other.
- CRUD operation behavior of dual-write async.
Dual-write is normally expected to move data between finance and operations apps and Dataverse almost immediately.
That near-real-time behaviour is valuable, but it also connects the source transaction to the availability, validation rules and processing limits of the receiving application.
For high-volume transactions, this can become a problem.
A transaction containing one header and hundreds of lines might fail because of timeouts, transaction-size limits or the time required to validate every related record.
Dual-write async changes that behaviour by moving the data through an internal background-processing queue.
This can reduce pressure on the live transaction, but it introduces a different consistency and failure model.
It is not simply a faster version of dual-write.
Important: Always check Microsoft still documents dual-write async as a preview feature. Preview features are not intended for production use and might have restricted functionality.
Synchronous and asynchronous dual-write are different models
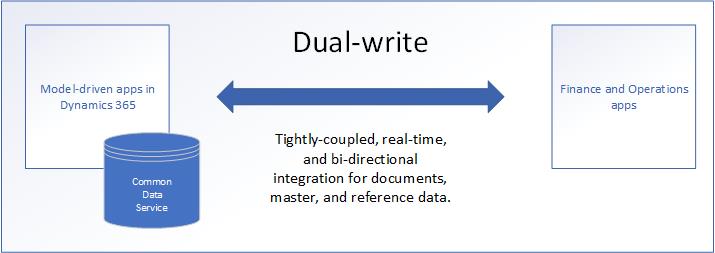
Standard dual-write provides tightly coupled, bidirectional and near-real-time integration between finance and operations apps and Dataverse.
With synchronous dual-write, the receiving application participates in the live transaction.
If a business validation fails in the receiving system, the originating transaction can also fail.
With dual-write async, the originating transaction and the integration transaction are separated.
| Synchronous dual-write | Dual-write async |
|---|
| Data is transferred as part of the live transaction | Data movement is processed in the background |
| The originating user might wait for the receiving system | The originating transaction is decoupled |
| Errors can immediately block the transaction | Errors might appear after the source transaction is committed |
| Both applications are expected to be consistent immediately | The applications become consistent after processing |
| Suitable when immediate cross-system consistency is required | Suitable when a short synchronisation delay is acceptable |
Async can improve the source-user experience, but it does so by accepting eventual consistency.
What eventual consistency means
Eventual consistency means the two applications might temporarily contain different information.
A record can be committed in Finance and Operations before the related record or update becomes available in Dataverse—or the other way around.
The background process then sequences and transfers the information.
This delay is acceptable only if the business process can continue safely while the two applications are temporarily different.
The correct question is therefore not:
Can this table use dual-write async?
It is:
Can the complete business transaction tolerate delayed consistency?
When dual-write async can be appropriate
Microsoft recommends considering entities that:
- Belong to one grouped transaction
- Have high transaction volumes
- Contain header-and-line relationships
- Regularly encounter synchronous transaction, timeout or size limits
- Do not require the receiving application to respond before the source transaction completes
When delayed synchronisation is not acceptable
Dual-write async is a poor fit when the next business step depends on the other application already having the latest information.
Examples include:
- A user creates an account in Dynamics 365 Sales and immediately creates a transaction in Finance and Operations
- Dataverse requires an F&O-generated identifier before continuing
- Credit validation depends on the latest customer balance
- Pricing relies on the most recent product, trade agreement or currency information
- Inventory availability must be accurate before confirming an order
- A Field Service process immediately consumes an item in Supply Chain Management
- An approval requires data written by the previous step
- Automation in the receiving system must execute before the user continues
Do not mix synchronous and asynchronous entities in one transaction
This is one of the most important design rules.
If a business transaction contains a mixture of:
- Entities configured for live synchronisation
- Entities configured for dual-write async
the transaction fails.
Microsoft states that a transaction should contain either:
- All asynchronous entities, or
- All synchronous entities
The error identifies the entities that are incorrectly configured.
This means async should not be enabled one table at a time without understanding the complete transaction boundary.
Consider a transaction containing:
- Order header
- Order lines
- Customer details
- Delivery address
- Charges
If the header and lines use async while another participating entity remains synchronous, the complete transaction can fail.
The design must follow the business transaction—not the individual map.
Deletes behave differently
Dual-write async currently supports only:
Delete operations do not use the async pipeline.
If a transaction contains a delete, the delete is processed through live synchronisation.
Microsoft treats deletes differently because removing dependent records under eventual consistency creates a greater risk of relationship and referential-integrity failures.
A solution architect should not assume that every operation for an async-enabled entity follows the same route.
Not every error can be retried
A common assumption is that anything processed asynchronously can simply be retried.
Dual-write async has several failure categories, and they behave differently.
| Failure type | Meaning | Retry behaviour |
|---|
| Application failure | A business validation or logical rule rejected the transaction | The underlying data or configuration must be corrected |
| System failure | An unresolvable system or platform issue interrupted processing | The system can retry it |
| Concurrency failure | The queued record is no longer the latest version | The record is skipped and cannot be retried |
| Conflict failure | The same record was changed in both applications | The configured primary system determines the winner |
For a system failure, the retry processes the record only if its version is still the latest.
If newer changes exist, replaying an older version could overwrite more recent data. The platform therefore uses record versions to protect the current state.
Why concurrency failures are not retried
Imagine the following sequence:
- A customer record is updated in Finance and Operations.
- Version 1 is added to the async processing queue.
- Before version 1 is processed, the record is updated again.
- Version 2 becomes the latest version.
- The background process reaches version 1.
Processing version 1 could temporarily overwrite newer information.
The platform therefore skips the outdated version and categorises it as a concurrency failure.
This behaviour prevents phantom or out-of-sequence updates, but it also means that “retry everything” is not a valid operational procedure.
Support teams need to understand the failure category before deciding what action to take.
How conflicts are resolved
A conflict can occur when the same record is edited in both applications before the queued update is processed.
Dual-write async uses the primary for conflict detection configuration to decide which side wins.
For example, if Finance and Operations is configured as primary:
- The Finance and Operations version overrides the Dataverse version.
- The update from Dataverse to Finance and Operations is rejected.
Conflict detection is based on a snapshot of the record state—not simply on the time shown in a record’s modified date.
Microsoft notes that record timestamps cannot be relied upon because:
- Not every record has an appropriate time field.
- The clocks in both systems might not be coordinated.
Conflict failures also require special monitoring because Microsoft states that they are not shown in the normal synchronisation-errors experience. They are visible in a back-end table.
Entity sequencing still matters
Entities within an async group are processed using a defined sequence.
A lower sequence number receives a higher execution priority.
This is necessary for referential integrity.
For example:
- Customer
- Order header
- Order line
Processing the line before the header—or the header before the required customer—could cause the transaction to fail.
Async removes the requirement to process everything as part of the user’s live transaction. It does not remove entity dependencies.
The dependency graph and sequence must reflect the actual data relationships.
The queue does not contain a copy of the data
Dual-write async does not use the Data Import/Export Framework to export and import the records.
Its internal queues contain references used to manage and sequence data movement. They do not hold a separate copy of the business data.
This is another reason why record versions matter.
By the time the queue reference is processed, the underlying record might have changed again.
Note: Dual-write async is event-driven and not scheduled driven, even though the data movement happens in the background.
A practical architecture example
Consider an order-entry process with one order header and 300 lines.
With synchronous dual-write:
- The user saves the order.
- All related records are transferred during the live transaction.
- Dataverse validations and platform limits participate in the save.
- A timeout or validation error can reject the source transaction.
With async dual-write:
- The user saves the order.
- The source transaction commits.
- References to the header and lines enter the processing queue.
- The background process applies sequencing and dependencies.
- Dataverse receives the records after the source transaction has completed.
The user might experience a faster save.
However, the order might not immediately be available to a Dataverse-based customer-service process. If one line fails a business validation, the support team must manage that failure after the user’s original transaction has already succeeded.
The performance benefit therefore comes with an operational cost.
Final thoughts
The most important design rule is simple:
Do not enable async because an individual table is slow. Enable it only when the complete business transaction can safely operate with eventual consistency.
For a process that depends on immediate cross-application validation, async can replace a performance problem with a consistency problem.
Official documentation: